Build a high resolution spectrograph in 15 minutes
- Science Toys
- Magnetism
- Electromagnetism
- Electrochemistry
- Radio
- Thermodynamics
- Aerodynamics
- Light and optics
- Simple laser communicator
- Make your own 3D pictures
- Making permanent rainbows.
- A solar powered marshmallow roaster
- Make a spectroscope from a CD.
- The impossible kaleidoscope
- Make a solar hotdog cooker
- Exploring invisible light
- A high resolution spectrograph.
- Time-lapse photography.
- High speed photography.
- Stacking photos for high depth of field.
- Biology
- Mathematics
- Computers and Electronics
A high resolution spectrograph
Building a home-brew recording spectrograph used to mean dealing with microcontrollers and stepper motors moving diffraction gratings past a light sensor, and although many were planned, few were actually built. Modern digital cameras and the Internet have combined to make building a laboratory quality high resolution spectrograph a task that can be done in fifteen minutes at your kitchen table, with a few plumbing parts. ...and a digital camera and Internet access, but you probably have access to both of those already. For the spectrograph you will need:- A 15 inch long black ABS plastic tube, 2 inches in diameter. These pipes are common plumbing items found at any hardware store, and they will usually cut the pipe to the length you want right there in the store.
- A rubber cap for the tube, with a hose clamp. These are found in the same section in the hardware store. The rubber cap is easy to cut with an Xacto® knife or razor blade.
- A 22½ degree 2 inch diameter ABS angled pipe coupling. In a pinch you could use a 45 degree angle, but the 22½ is perfect.
- A 2 inch diameter circle of 1000 line-per-millimeter holographic diffraction grating. We carry this item in our catalog.
- Some cardboard from the back of a writing pad or a shoe box.
- Some glue.
- An 8½ by 11 inch sheet of black construction paper. We will roll this up and insert it into the tube to eliminate reflections.
 Click on the photo for a larger image.
The first thing we do is cut a slit into the center of the rubber cap.
Click on the photo for a larger image.
The first thing we do is cut a slit into the center of the rubber cap.
 Click on the photo for a larger image.
We hold the slit open with little pieces of thick paper.
You could use slivers of cardboard cut from a cereal box, but I found the cardboard
cover of the razor blade I was using to cut the slit was just perfect. The slit
is now as wide as the paper. A wider slit will let in more light, but will make
broader lines in the spectrum, giving you less resolution. You can experiment with
the spacing to get a slit that suits your needs.
You can also decide to use a longer tube, together with a wider slit, or a shorter
tube and a narrower slit. The longer tube will make a fat slit look thinner.
Roll up the black construction paper so that it fits neatly against the inside of the
tube, and slide it all the way in. Now put the rubber cap with the slit in it on the
end of the tube.
Next we cut a two inch circle out of cardboard from the back of a tablet, or a shoe box.
Cut a circle out of the inside to form a ring. We glue the diffraction grating to the
cardboard ring, and then trim off the excess diffraction grating film once the glue has
dried completely.
Click on the photo for a larger image.
We hold the slit open with little pieces of thick paper.
You could use slivers of cardboard cut from a cereal box, but I found the cardboard
cover of the razor blade I was using to cut the slit was just perfect. The slit
is now as wide as the paper. A wider slit will let in more light, but will make
broader lines in the spectrum, giving you less resolution. You can experiment with
the spacing to get a slit that suits your needs.
You can also decide to use a longer tube, together with a wider slit, or a shorter
tube and a narrower slit. The longer tube will make a fat slit look thinner.
Roll up the black construction paper so that it fits neatly against the inside of the
tube, and slide it all the way in. Now put the rubber cap with the slit in it on the
end of the tube.
Next we cut a two inch circle out of cardboard from the back of a tablet, or a shoe box.
Cut a circle out of the inside to form a ring. We glue the diffraction grating to the
cardboard ring, and then trim off the excess diffraction grating film once the glue has
dried completely.
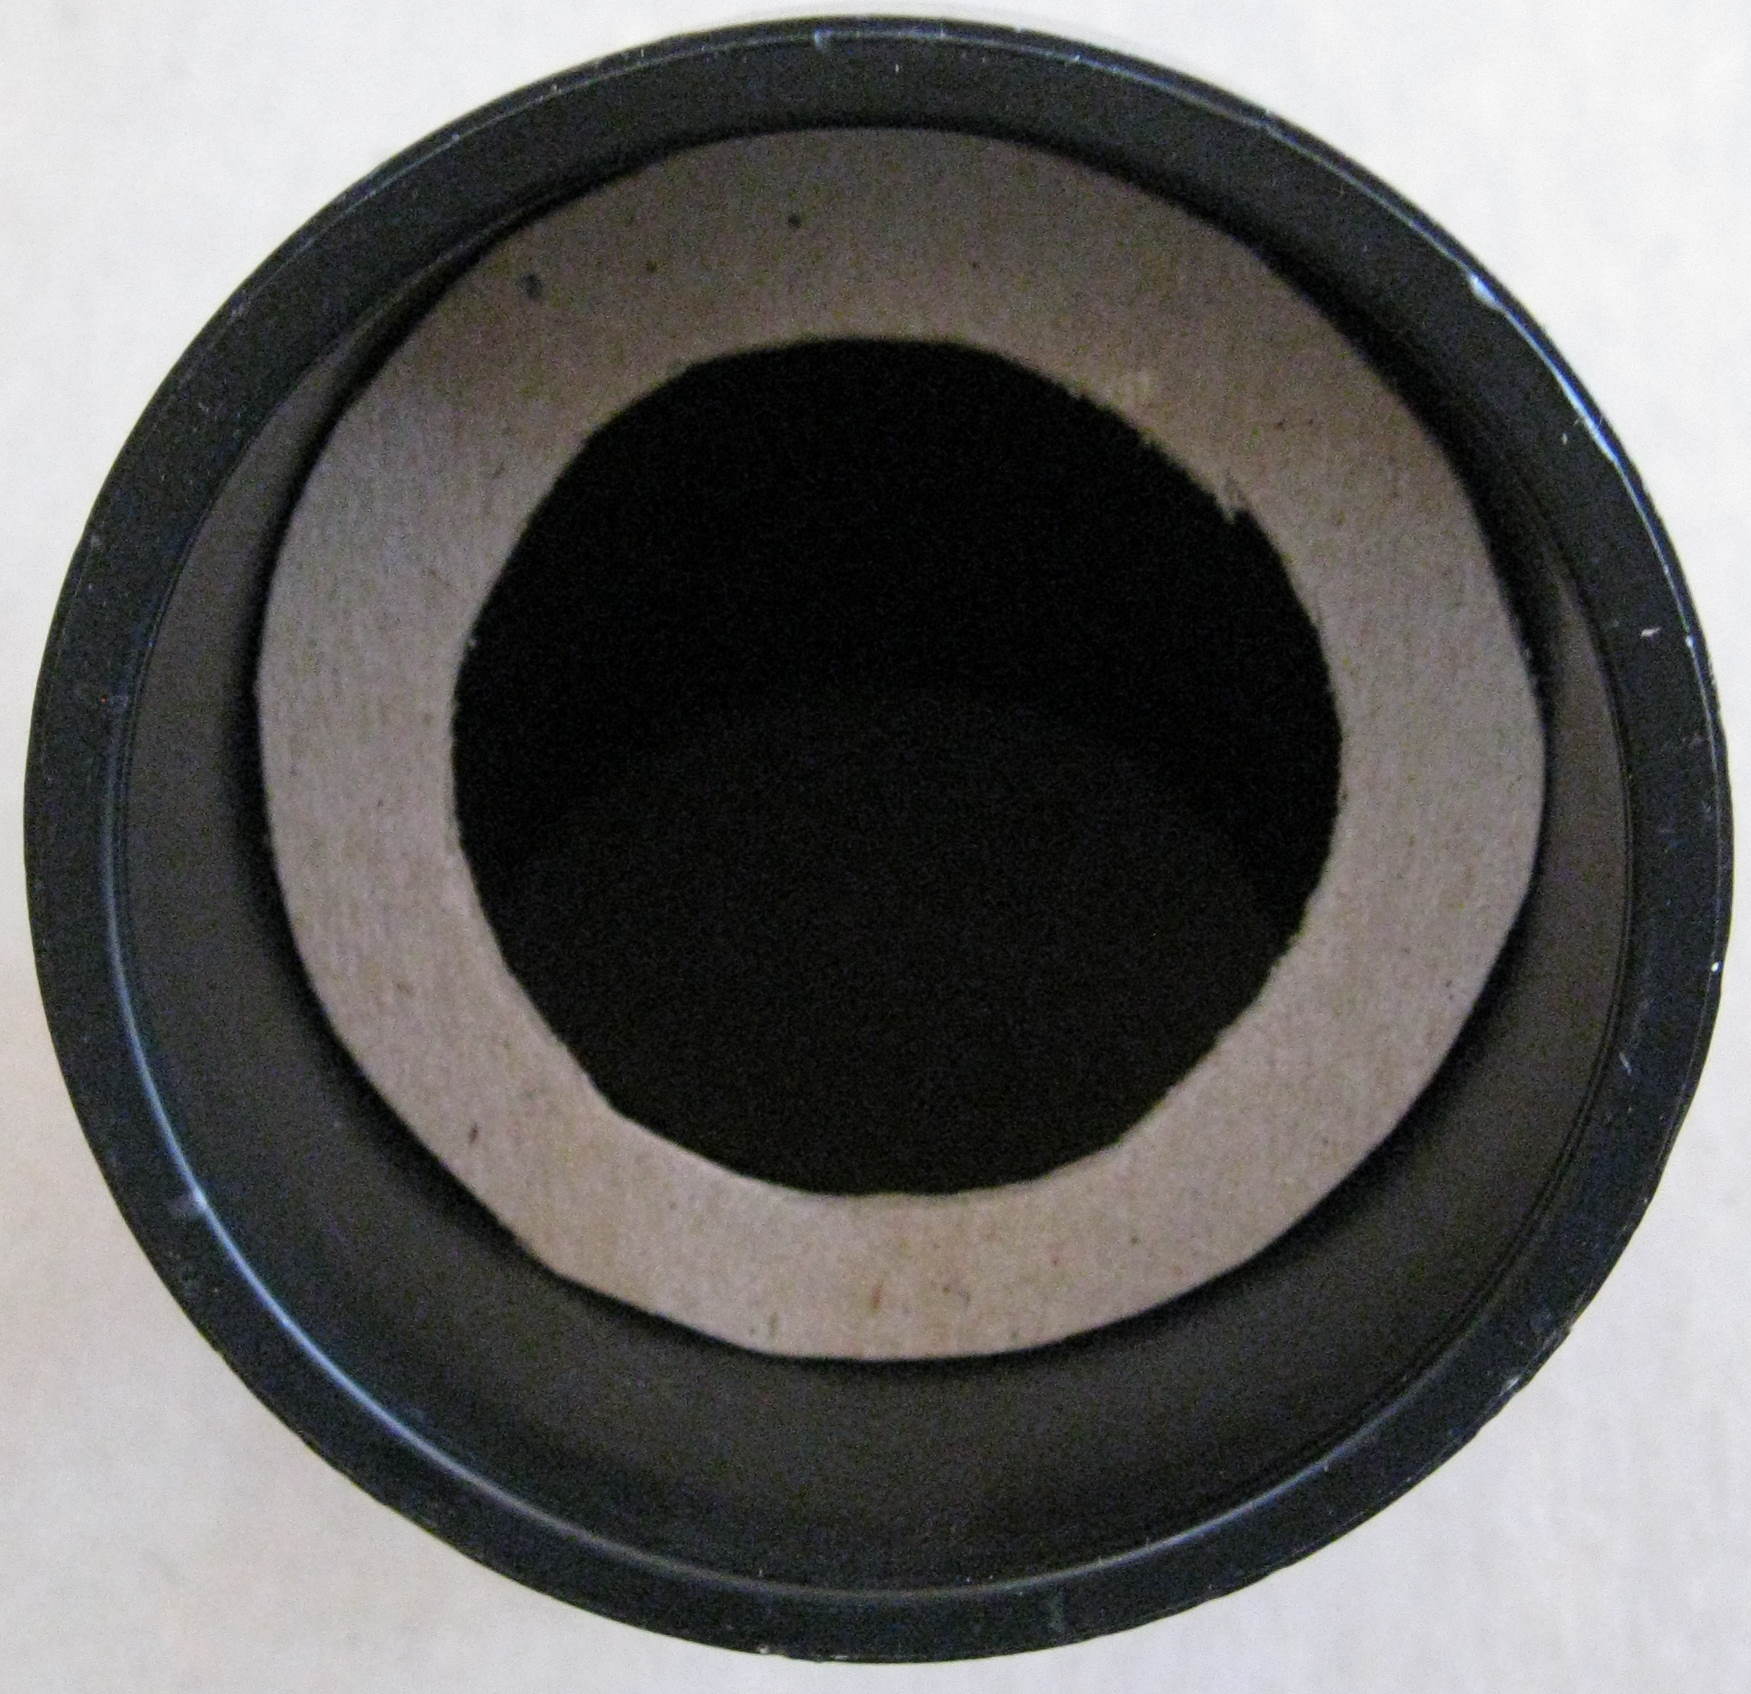
 Click on the photo for a larger image.
Next we insert the diffraction grating ring into the end of the angle fitting, and press the
tube in after it. This keeps it in place, but allows the film to be removed for cleaning,
and to be rotated easily to line up with the slit.
Click on the photo for a larger image.
Next we insert the diffraction grating ring into the end of the angle fitting, and press the
tube in after it. This keeps it in place, but allows the film to be removed for cleaning,
and to be rotated easily to line up with the slit.
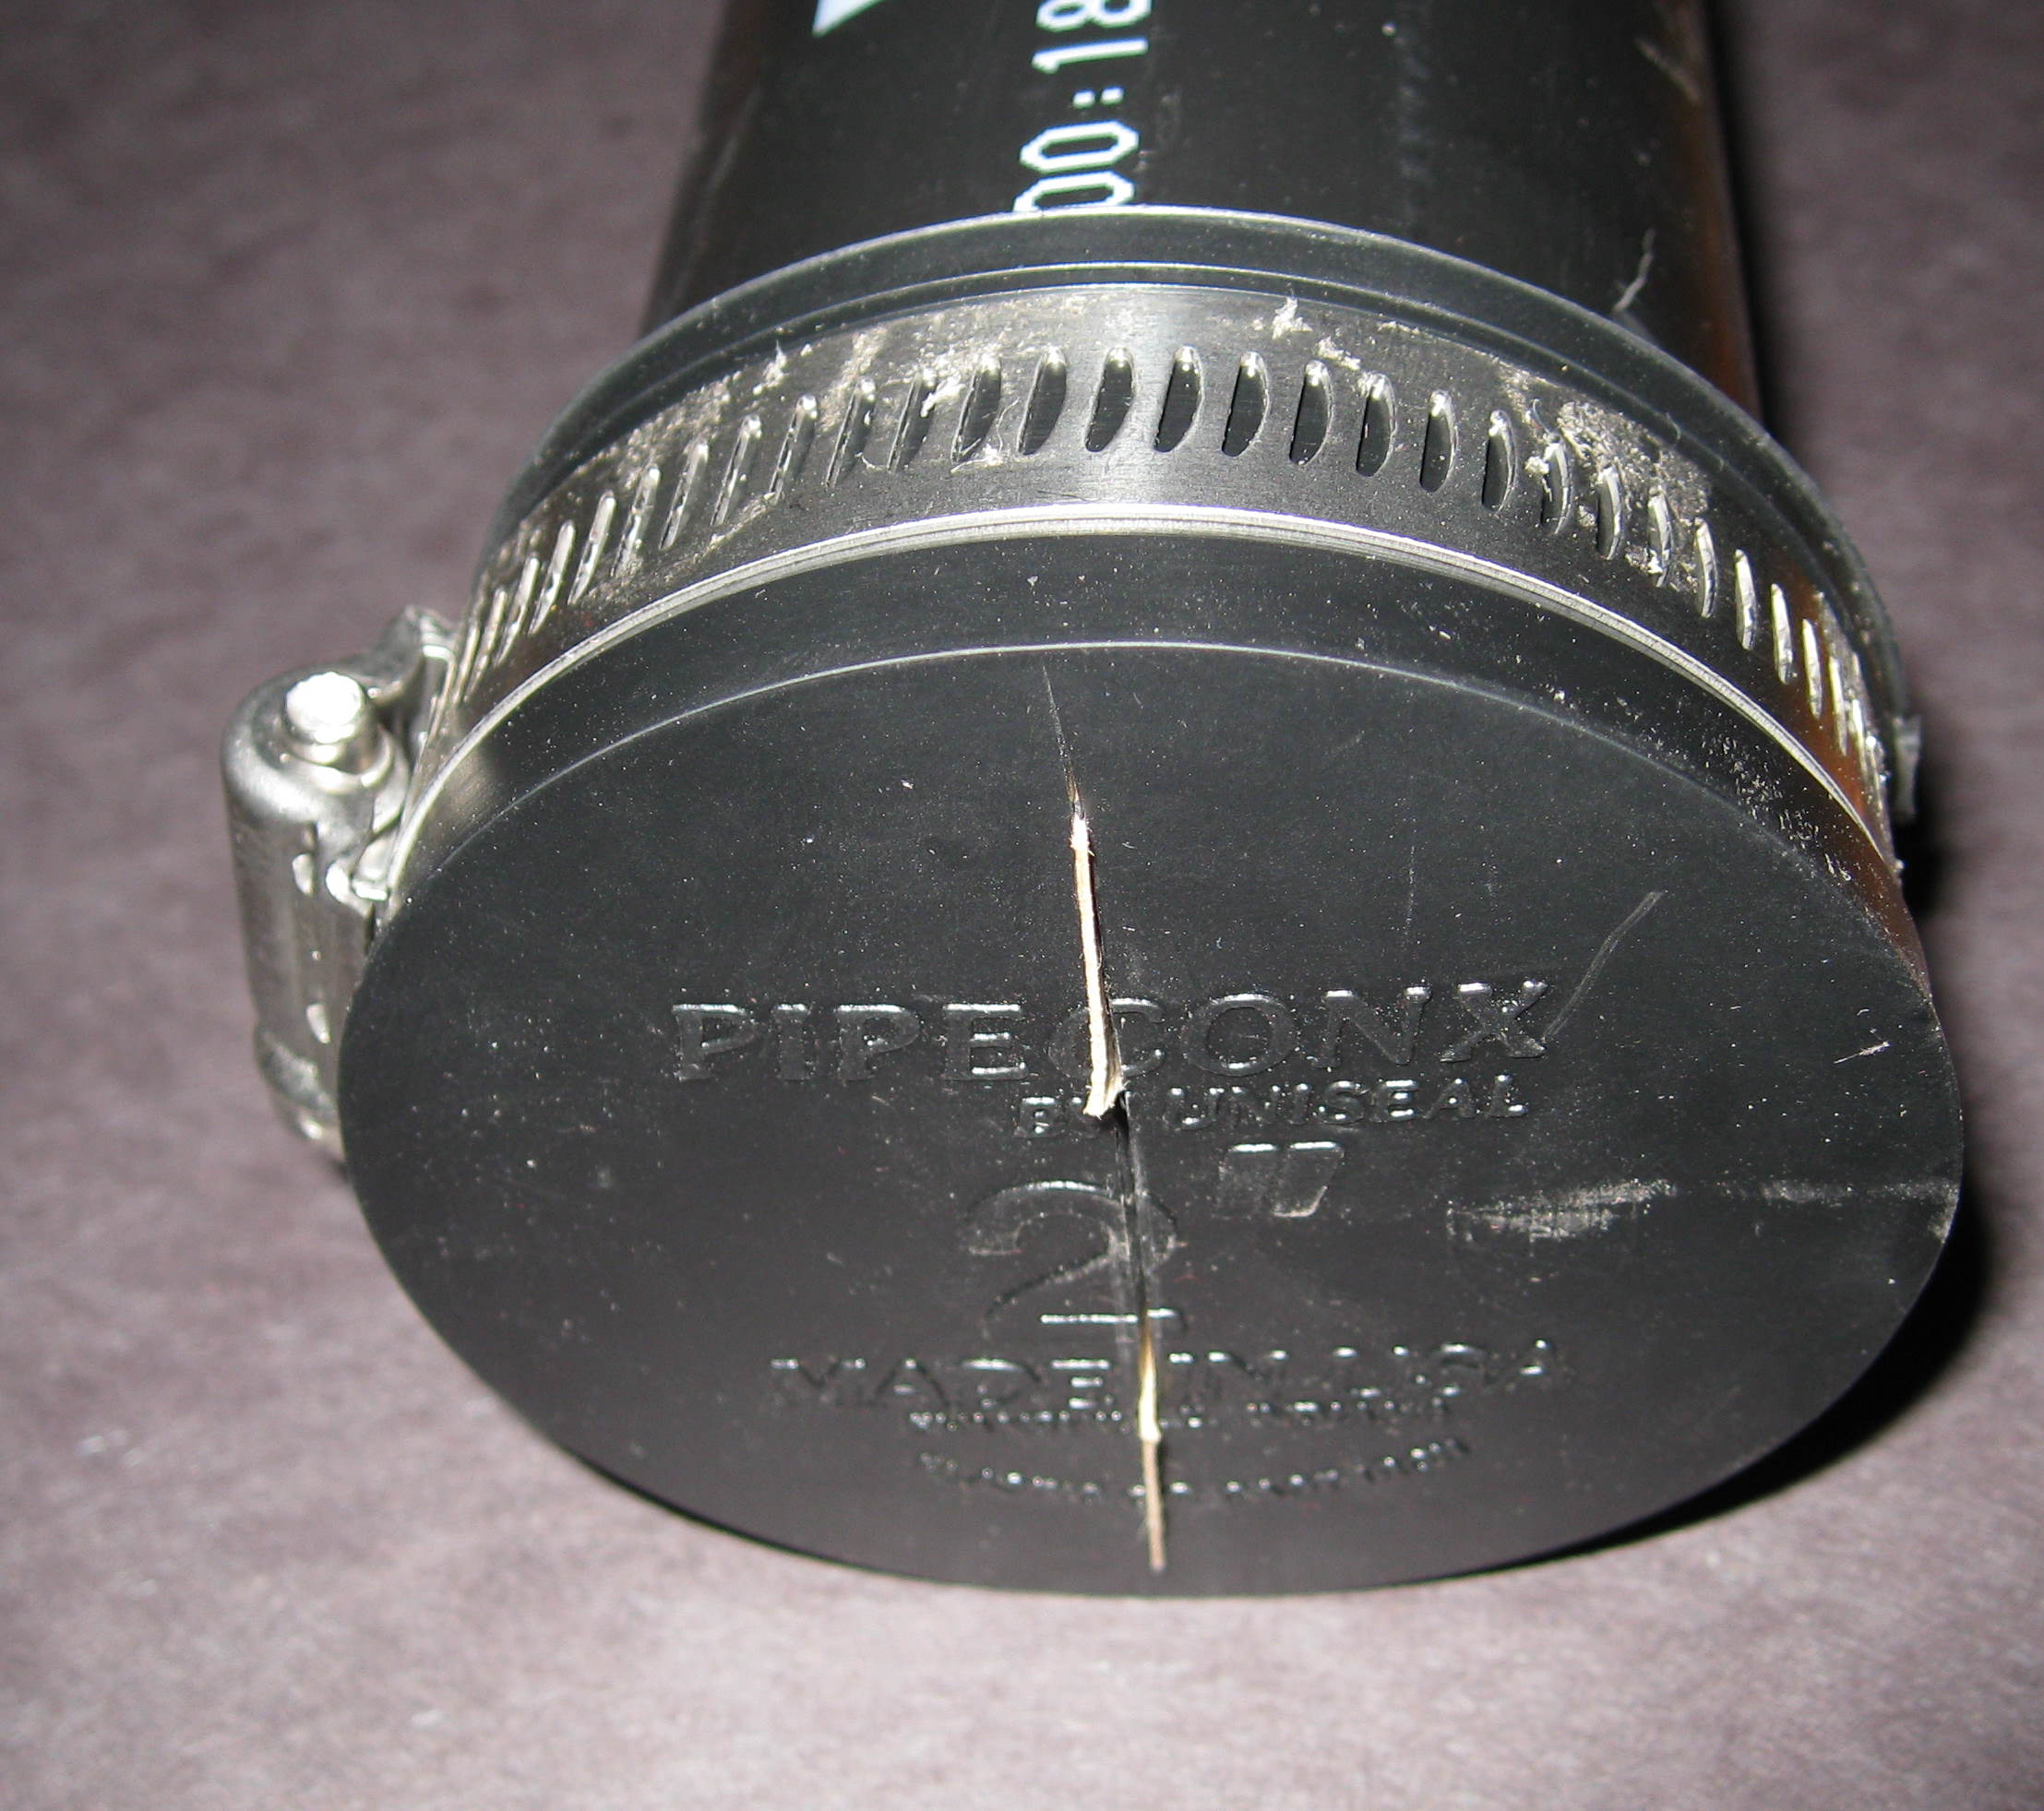
 Click on the photo for a larger image.
Hold the slit up to the light and look into the angle fitting to see the spectrum. Rotate the
rubber cap until the slit and the grating are aligned, and the spectrum is a neat rectangle,
instead of a parallelogram. You can rotate the grating instead if that is more convenient.
Rotate the pipe clamp so the screw part is perpendicular to the slit. This will act as a stand
that keeps the slit vertical by preventing the tube from rolling.
Click on the photo for a larger image.
Hold the slit up to the light and look into the angle fitting to see the spectrum. Rotate the
rubber cap until the slit and the grating are aligned, and the spectrum is a neat rectangle,
instead of a parallelogram. You can rotate the grating instead if that is more convenient.
Rotate the pipe clamp so the screw part is perpendicular to the slit. This will act as a stand
that keeps the slit vertical by preventing the tube from rolling.
 Click on the photo for a larger image.
That's it! We're done!
Click on the photo for a larger image.
That's it! We're done!
Using the high resolution spectrograph
You can use the tube as it is, and just look at the spectra. In this mode, it is a spectroscope. A spectrograph is something that records and analyzes the spectrum. For that, we need the camera and the Internet.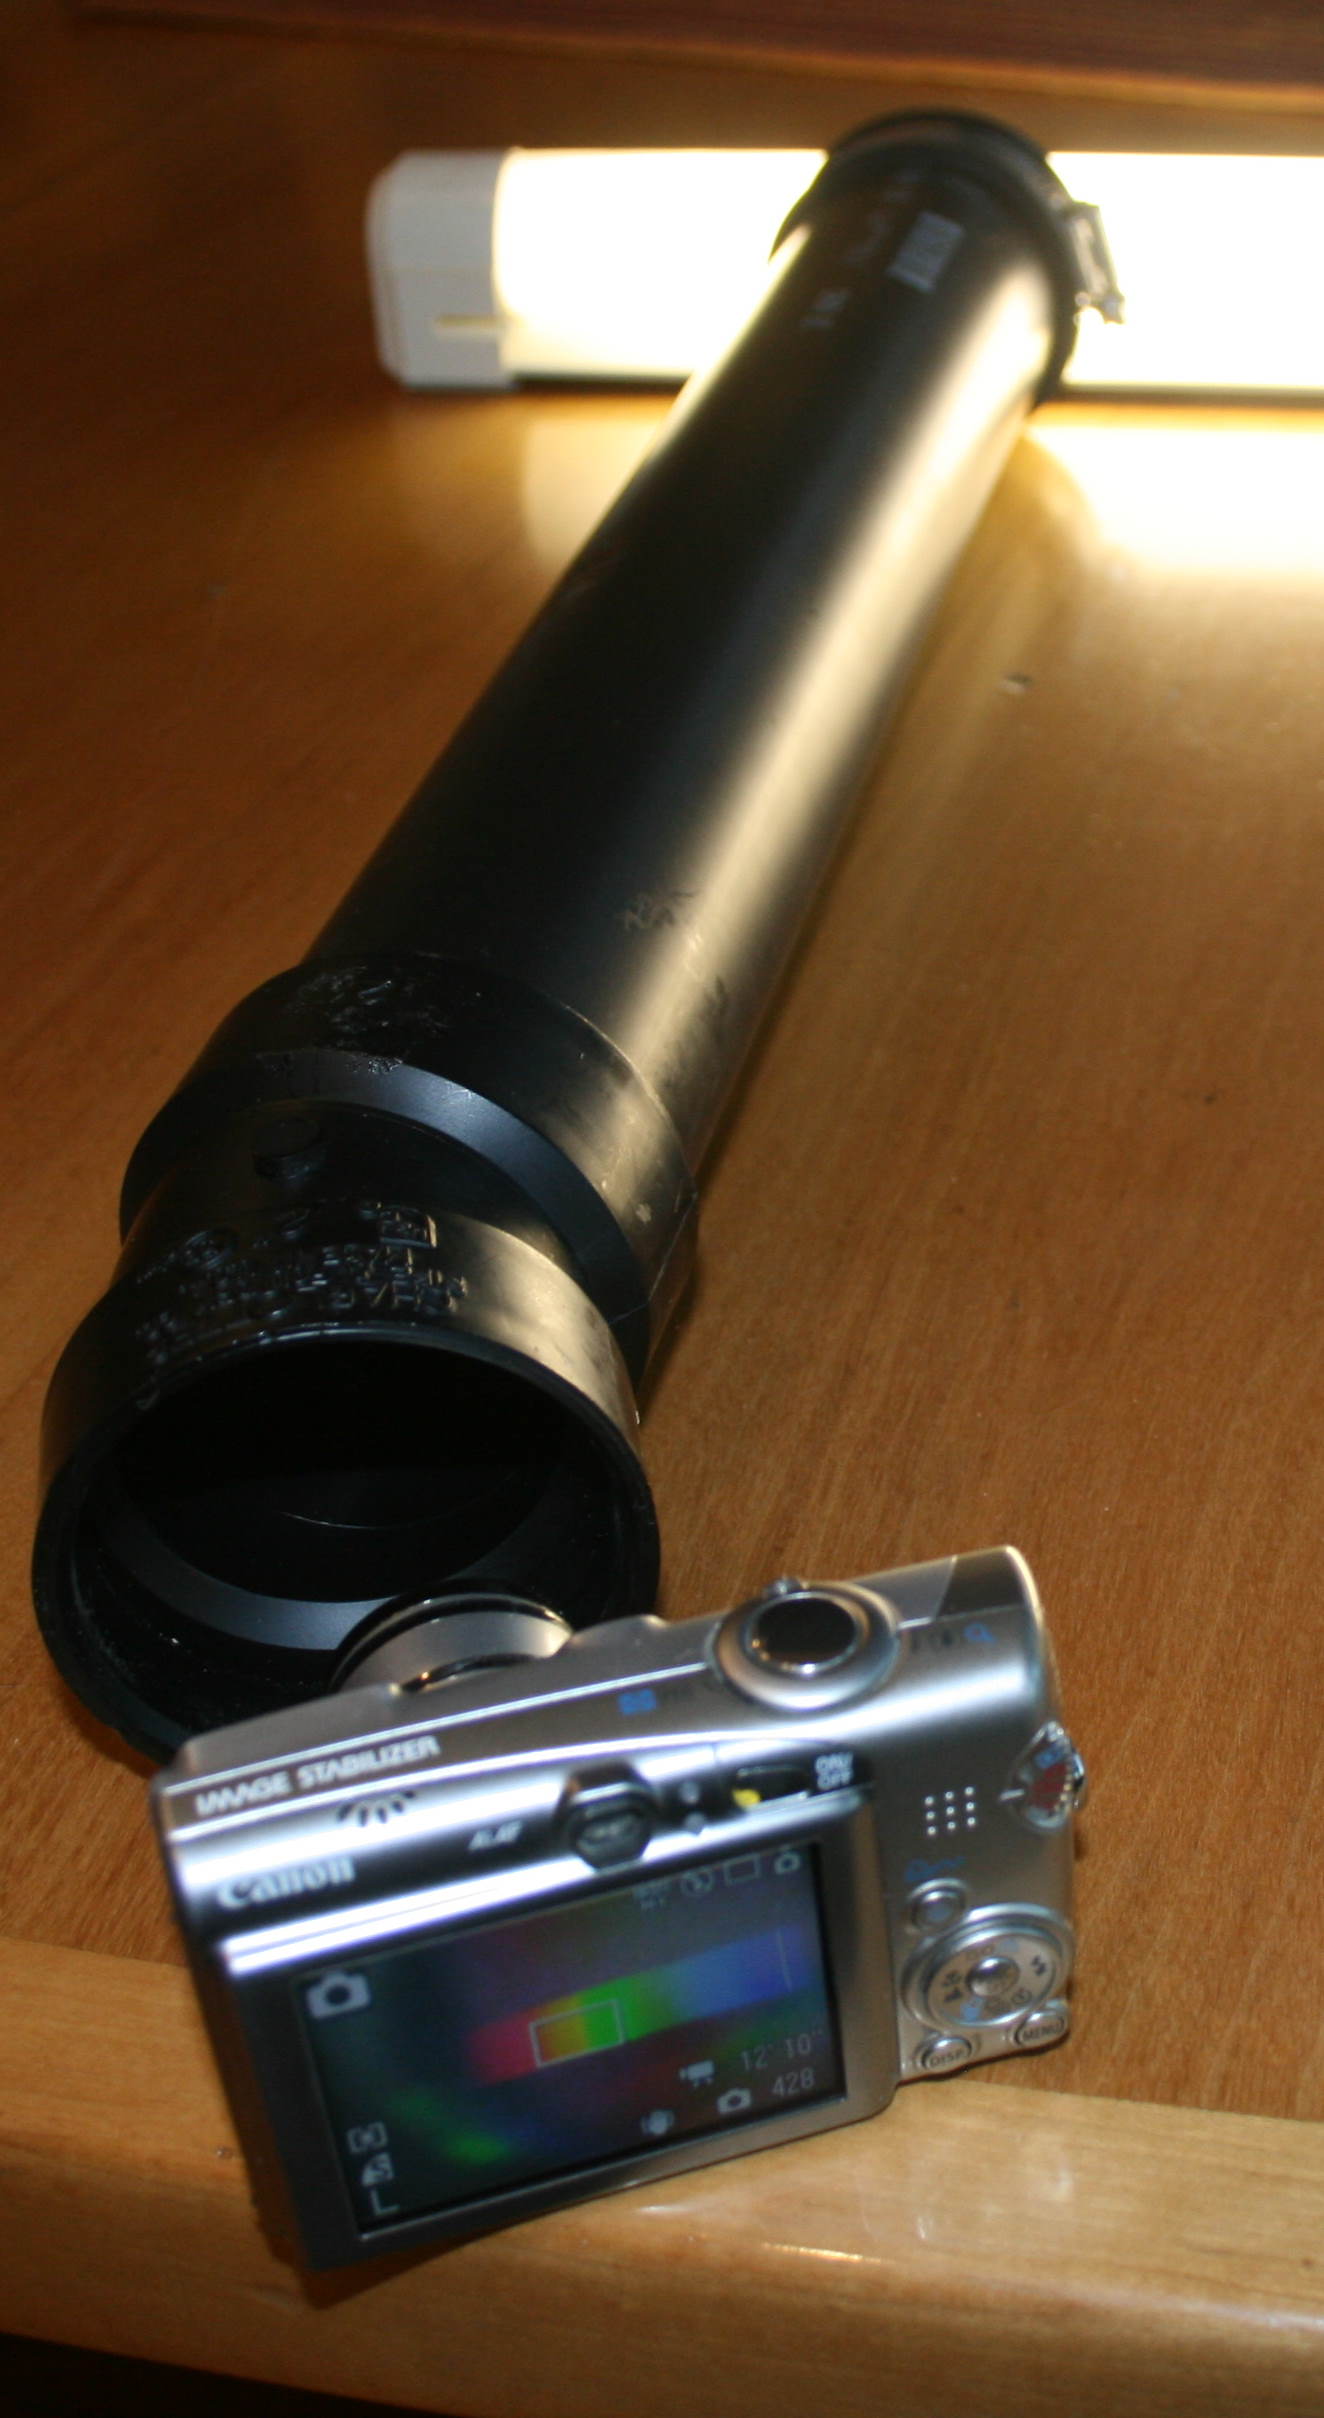 Click on the photo for a larger image.
Use the zoom lens on the camera to make the spectrum fill the viewfinder as much as
possible. This will get you the highest resolution. The more pixels your camera
has, the better the result will be, but inexpensive cameras will work pretty well.
Click on the photo for a larger image.
Use the zoom lens on the camera to make the spectrum fill the viewfinder as much as
possible. This will get you the highest resolution. The more pixels your camera
has, the better the result will be, but inexpensive cameras will work pretty well.
 Click on the photo for a larger image.
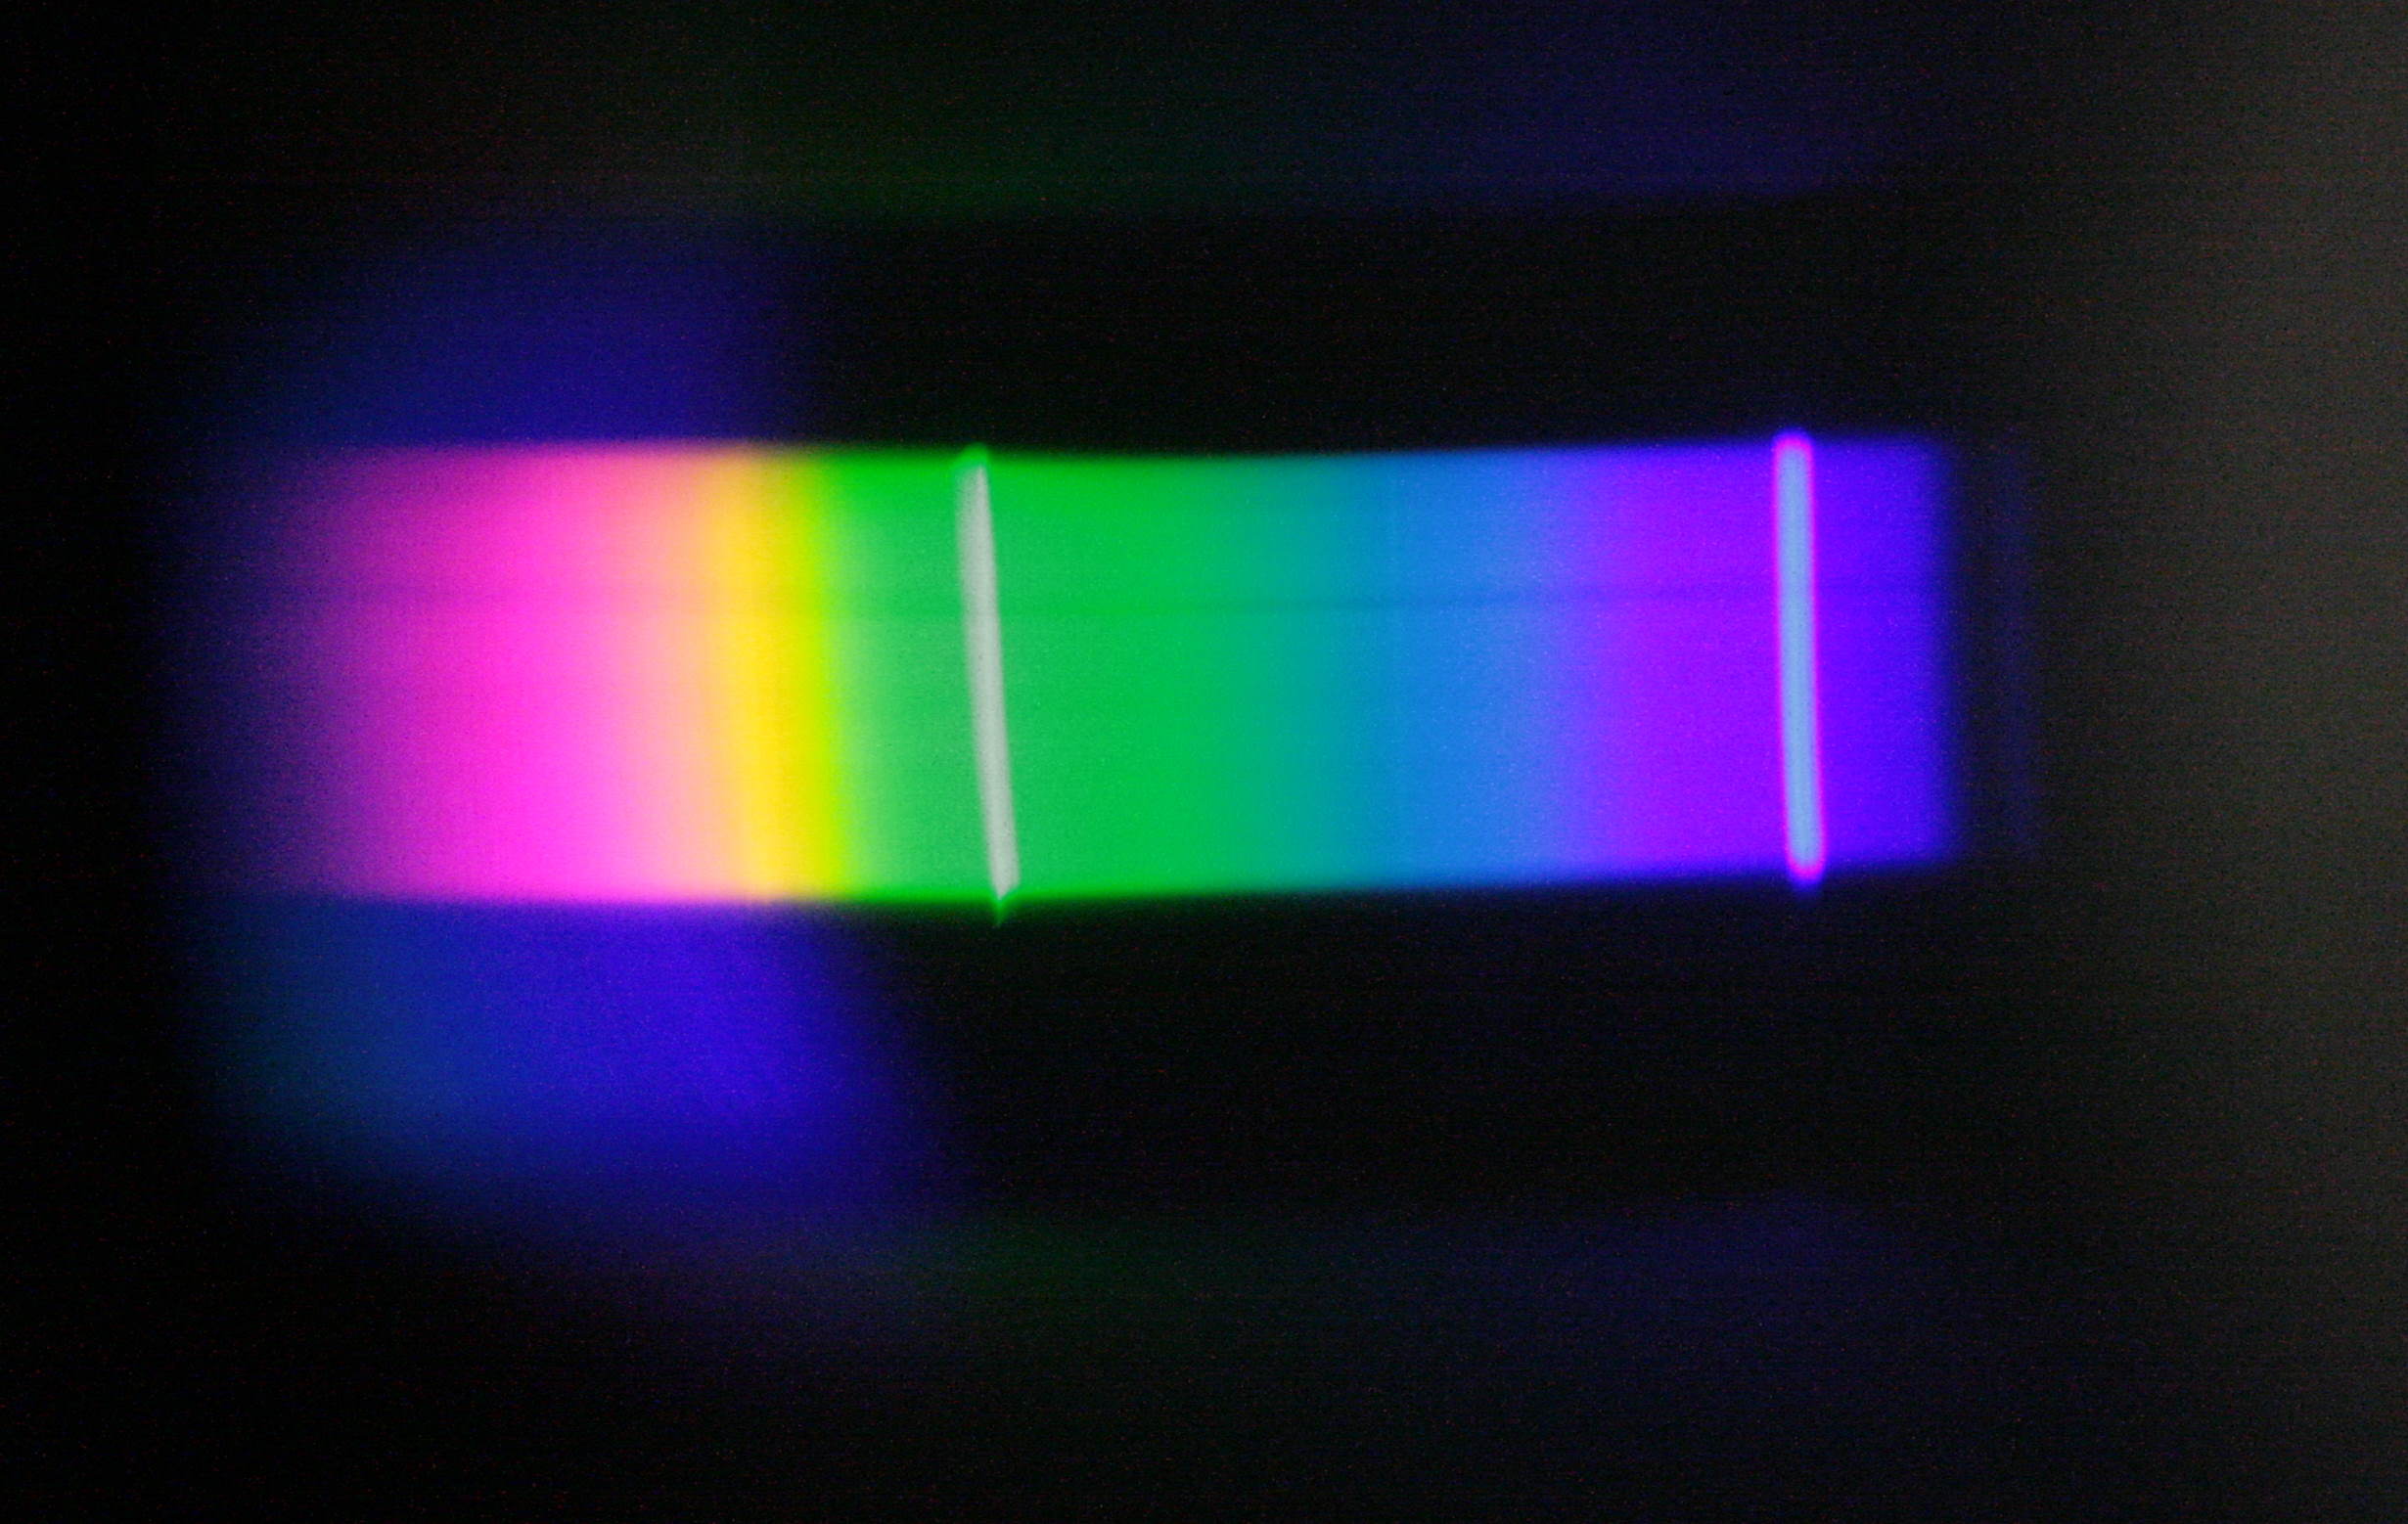
Avoid the temptation to take a colorful rainbow picture like the one above.
This one is overexposed for our purposes, and the lines are all smeared out.
Click on the photo for a larger image.
Avoid the temptation to take a colorful rainbow picture like the one above.
This one is overexposed for our purposes, and the lines are all smeared out.
 Click on the photo for a larger image.
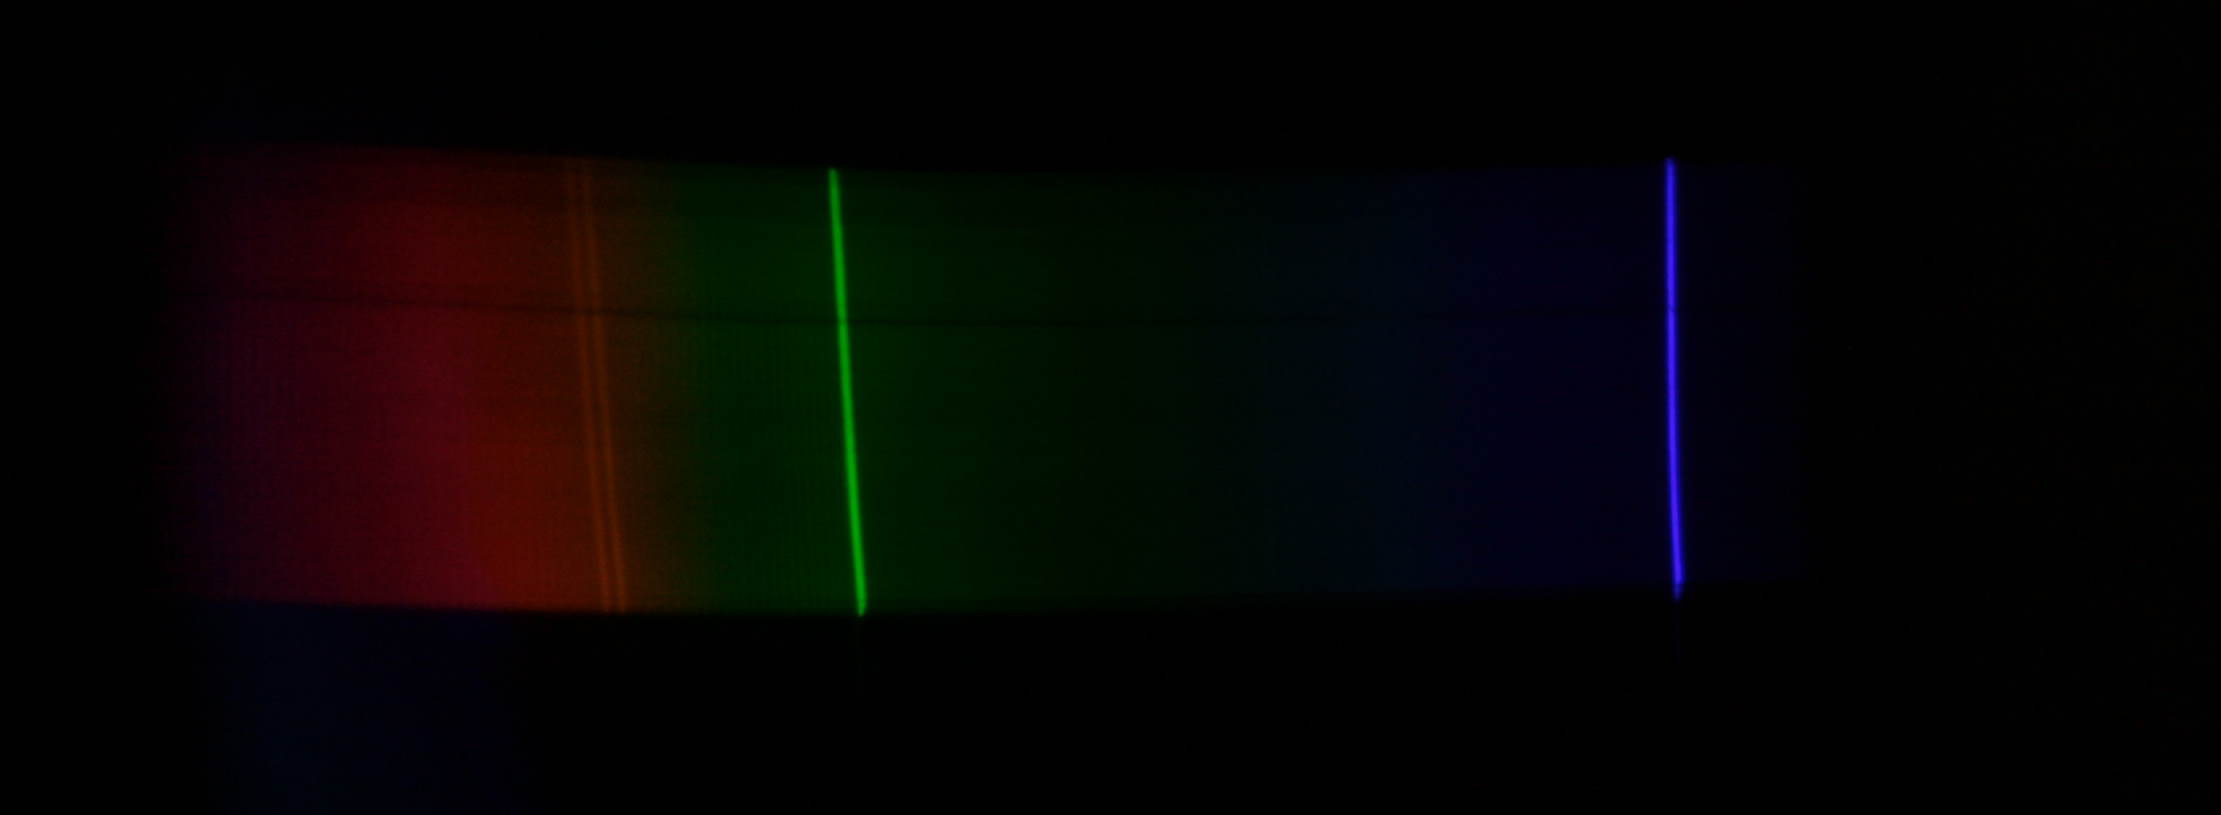
A properly exposed image will be very dark, with only four or maybe six of the mercury lines
from the fluorescent light being visible.
Take the picture. In fact, take several, using different exposure times and aperture
settings if your camera has those abilities. Load the photos onto your computer, and
crop them so that just the spectrum is visible.
The box below has a form that will let you upload your spectra to the analysis program.
Click on the photo for a larger image.
A properly exposed image will be very dark, with only four or maybe six of the mercury lines
from the fluorescent light being visible.
Take the picture. In fact, take several, using different exposure times and aperture
settings if your camera has those abilities. Load the photos onto your computer, and
crop them so that just the spectrum is visible.
The box below has a form that will let you upload your spectra to the analysis program.
Simple spectrum analyzer (spectrograph)
 Click on the photo for a larger image.
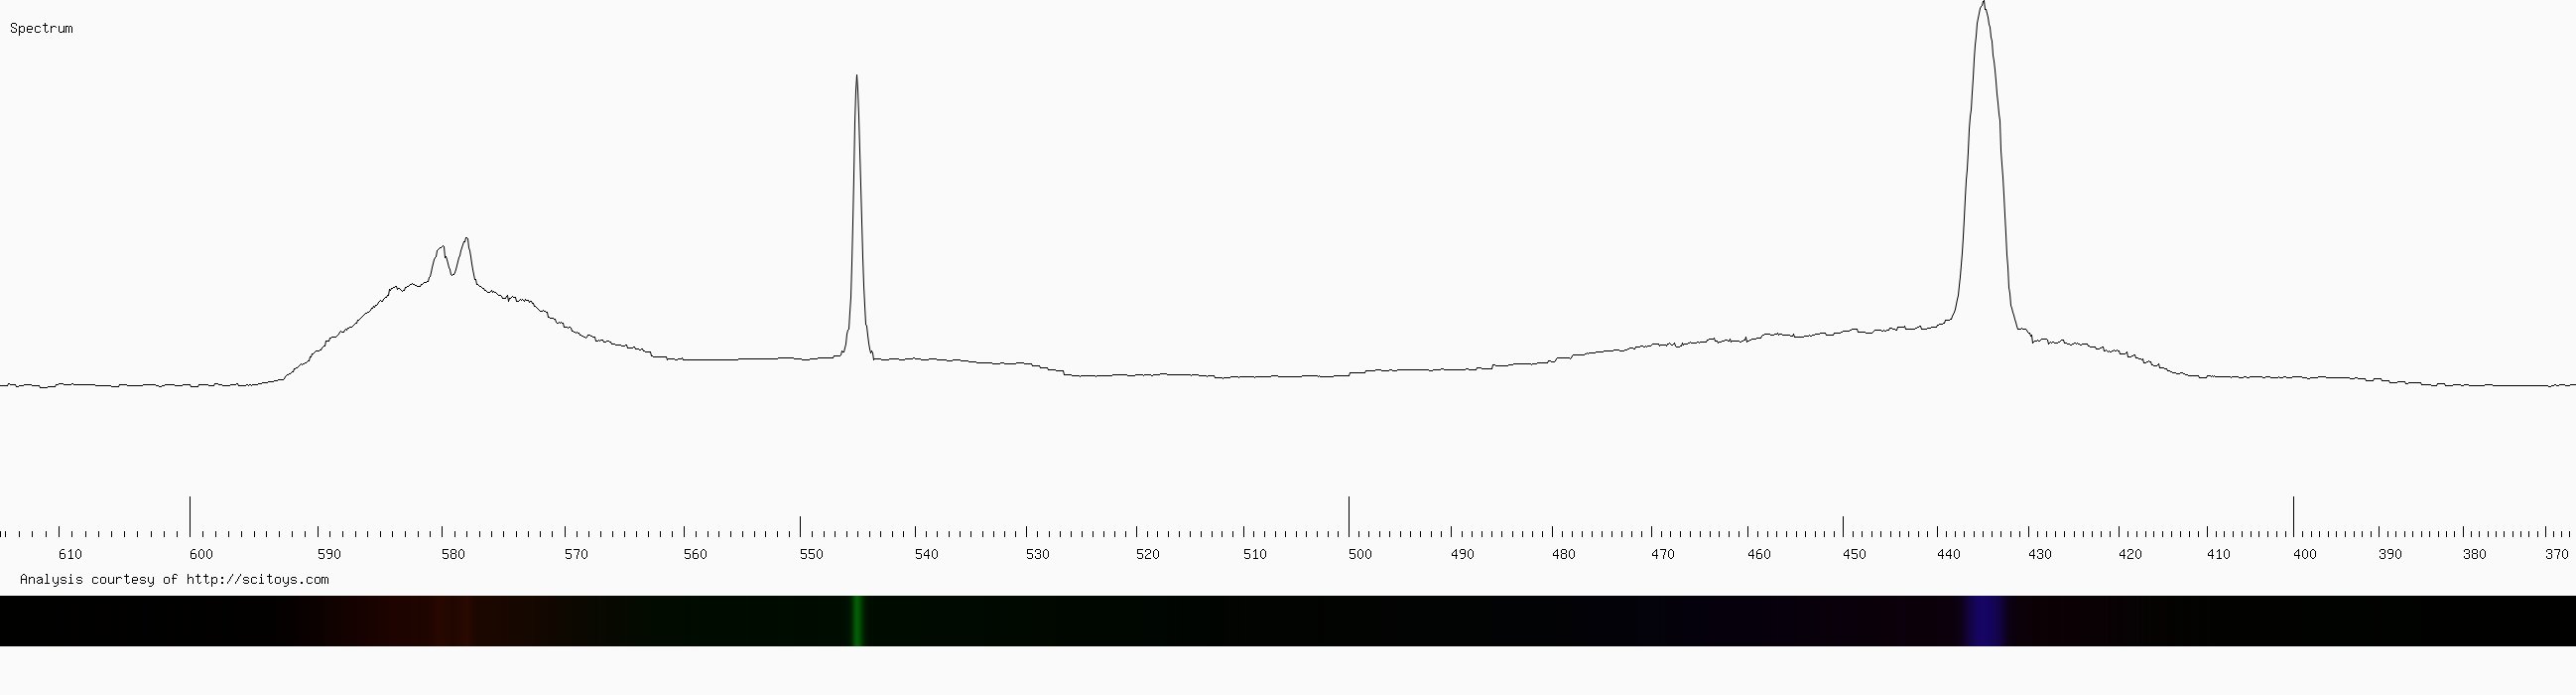
You can see four peaks in the graph, corresponding to four of the bright lines
in the spectrum of mercury vapor. The brighter the lines, the taller the peaks.
But we can do even more with our spectrograph. If you place a sample of some
transparent material or liquid between the light and the bottom half of the
slit, you will get a spectrum where the top half is the fluorescent light, and
the bottom half is the same light, but filtered through the material.
Click on the photo for a larger image.
You can see four peaks in the graph, corresponding to four of the bright lines
in the spectrum of mercury vapor. The brighter the lines, the taller the peaks.
But we can do even more with our spectrograph. If you place a sample of some
transparent material or liquid between the light and the bottom half of the
slit, you will get a spectrum where the top half is the fluorescent light, and
the bottom half is the same light, but filtered through the material.
 Click on the photo for a larger image.
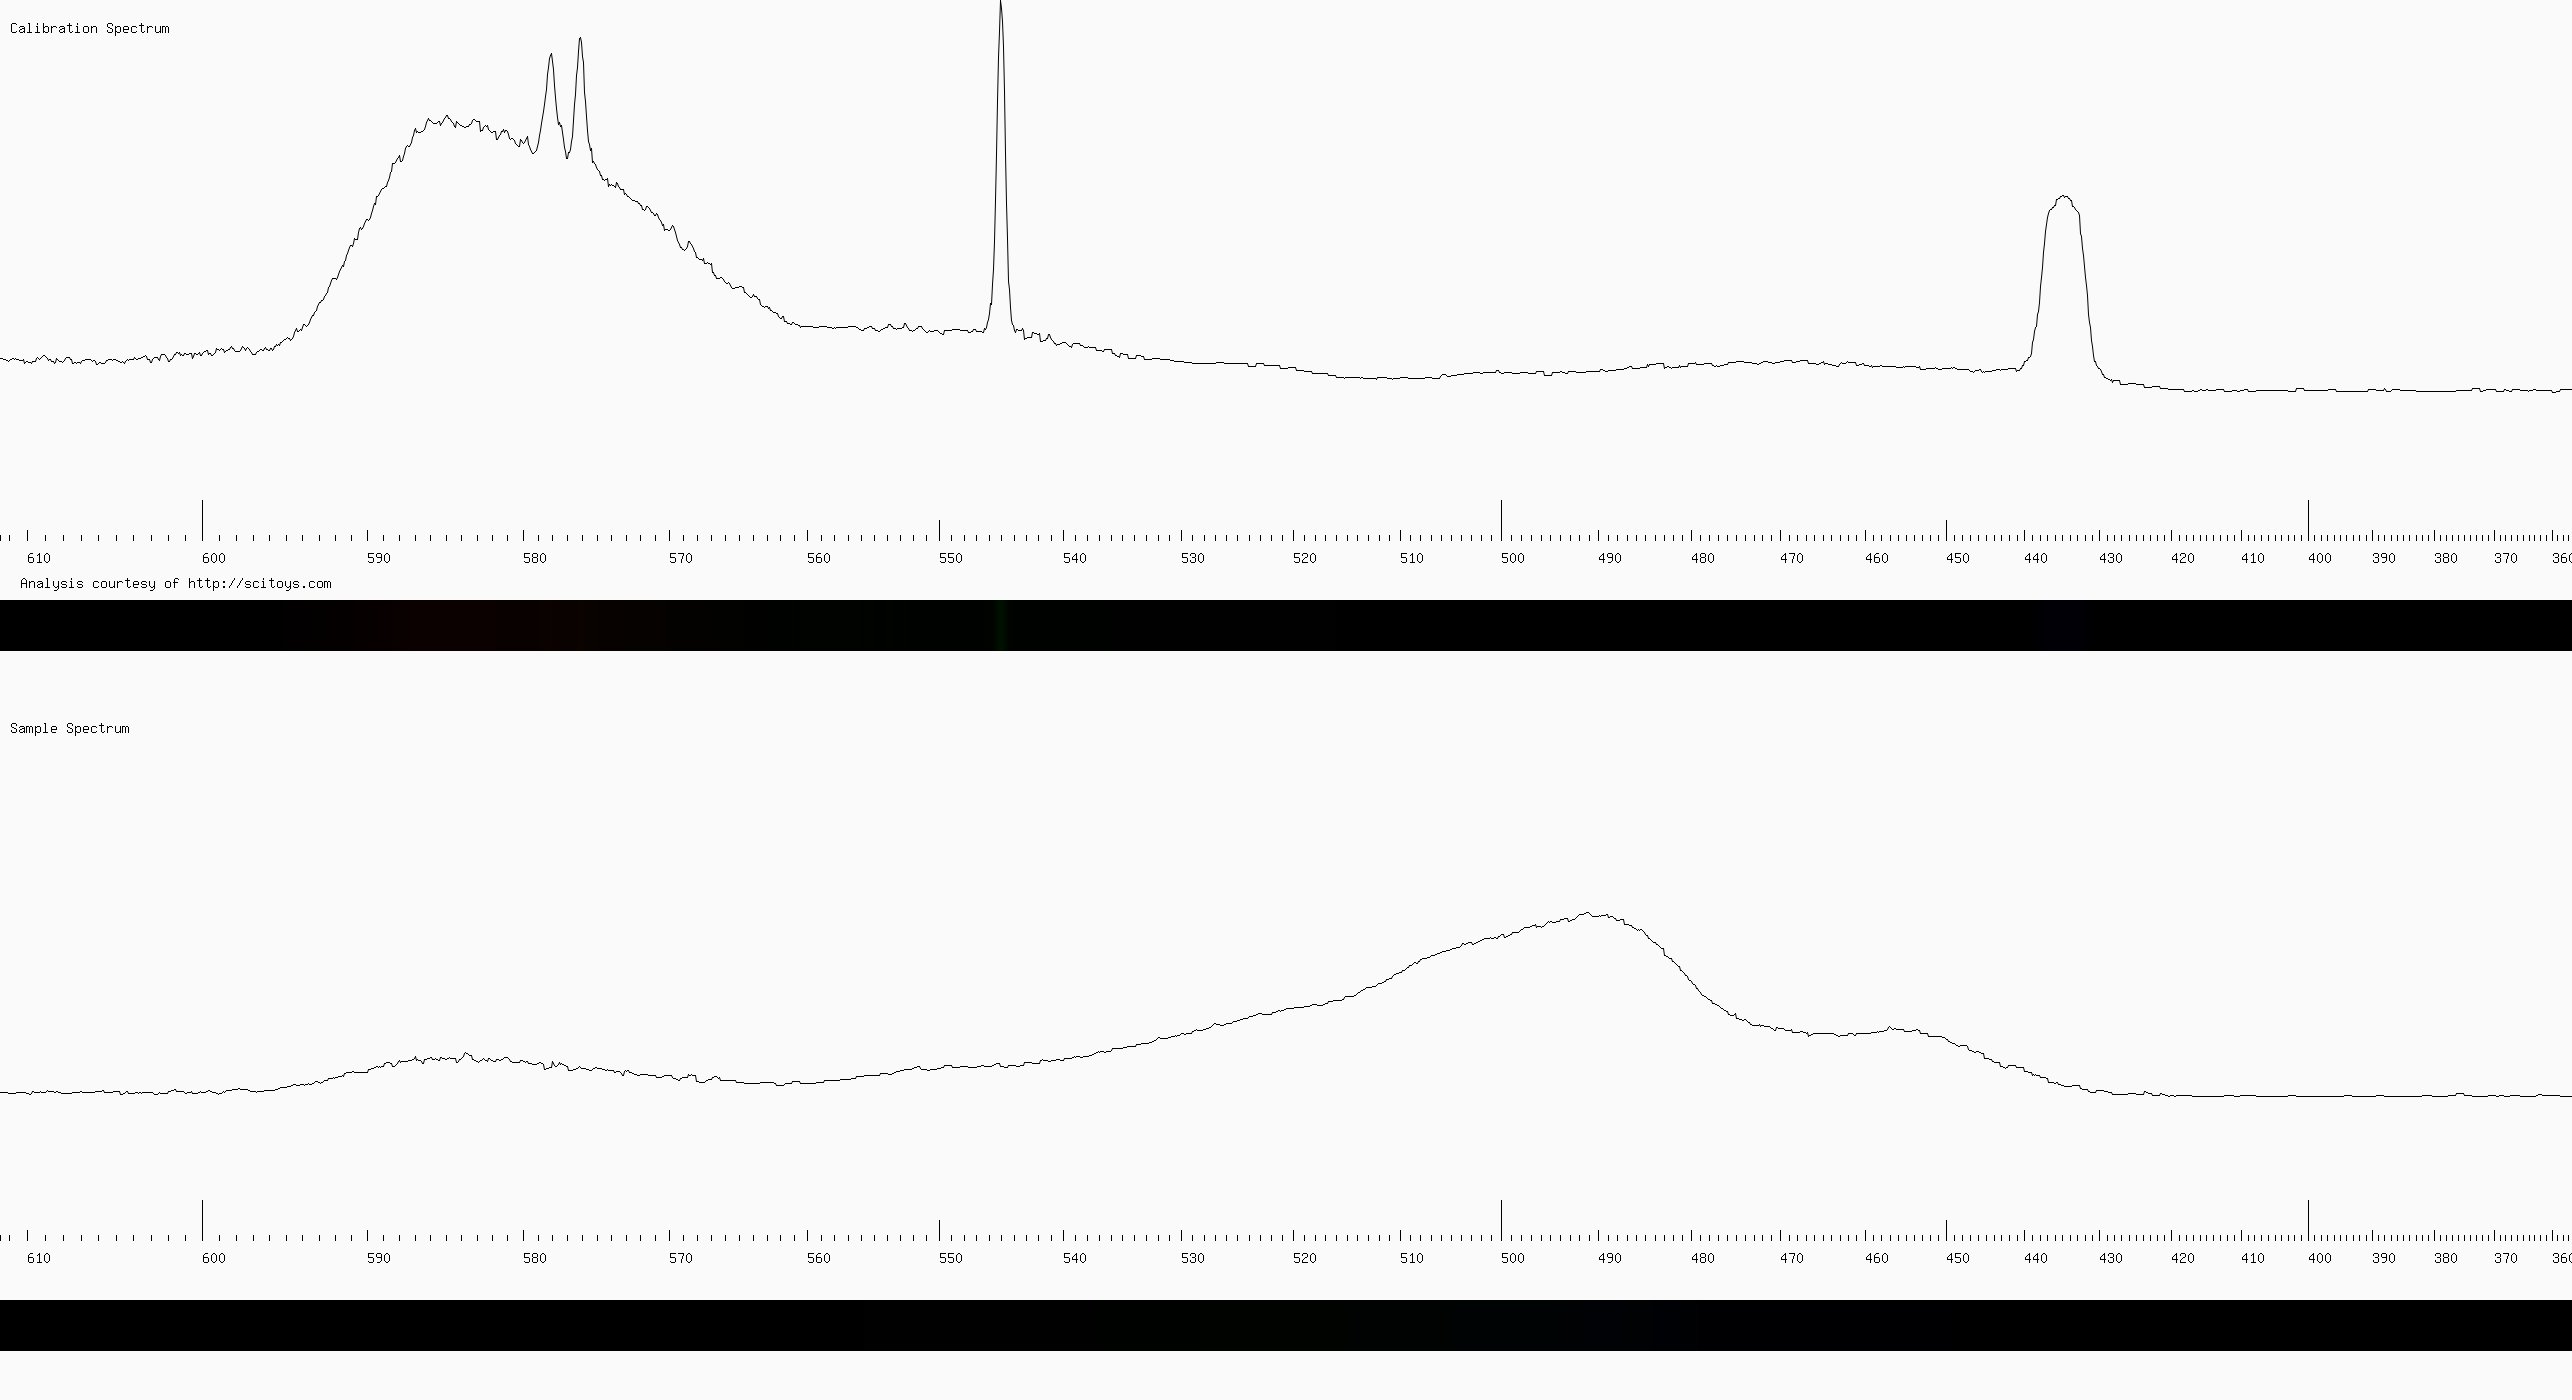
The analysis results in two graphs. The top graph is the
calibration graph, and is the same graph we just looked at. The bottom graph is
the spectrum of the light that passed through the sample.
In this particular sample, instead of letting the fluorescent light pass through
my sample (which was a bit of transparent green plastic), I had a second light
source (a white LED) shining through the sample. This produced a continuous spectrum,
so the peaks of the mercury vapor did not interfere with the analysis. A bit of
aluminum foil kept the calibration light and the sample light separate, dividing
the slit into two parts, a top half and a bottom half.
Click on the photo for a larger image.
The analysis results in two graphs. The top graph is the
calibration graph, and is the same graph we just looked at. The bottom graph is
the spectrum of the light that passed through the sample.
In this particular sample, instead of letting the fluorescent light pass through
my sample (which was a bit of transparent green plastic), I had a second light
source (a white LED) shining through the sample. This produced a continuous spectrum,
so the peaks of the mercury vapor did not interfere with the analysis. A bit of
aluminum foil kept the calibration light and the sample light separate, dividing
the slit into two parts, a top half and a bottom half.
How does it do that?
The diffraction grating is a transparent plastic with dark lines on it spaced 1/500th of a millimeter (2 microns) apart. Light waves go through the spaces between the lines (we call those spaces slits, since they are similar to the slit we made with the razor blade in the rubber cap). Waves that go through one slit interfere with waves going through the next slit, and produce bands of light and dark, where the waves interfere constructively to form bright bands and destructively to form dark bands. The light bands form where the waves from one slit and from the next slit are both an integer number of wavelengths from the diffraction grating. Since this depends on the wavelength, different colors will form bright bands in different places. In this way, the colors become separated into the rainbow we call the spectrum. The mercury vapor in the fluorescent light does not produce all colors. It produces only a few colors — the ones we see as bright lines in our spectrum, plus some in the infrared and ultraviolet which the camera cannot capture. The white light comes from phosphors painted on the inside of the glass that glow when the blue and ultraviolet light from the mercury vapor hits them. These phosphors do not emit as much light as the mercury vapor, so we can easily see the bright lines in the spectrum, especially if we set the camera to record less light. The computer program looks at each column of pixels in the photo, and adds them up to get a value for how much light of that color entered the camera. It then plots this value for each column, forming the graph. For more information on light and optics, see the Recommended Reading section. Next: Time-lapse photography Order diffraction grating here. Del.icio.us- Science Toys
- Magnetism
- Electromagnetism
- Electrochemistry
- Radio
- Thermodynamics
- Aerodynamics
- Light and optics
- Simple laser communicator
- Make your own 3D pictures
- Making permanent rainbows.
- A solar powered marshmallow roaster
- Make a spectroscope from a CD.
- The impossible kaleidoscope
- Make a solar hotdog cooker
- Exploring invisible light
- A high resolution spectrograph.
- Time-lapse photography.
- High speed photography.
- Stacking photos for high depth of field.
- Biology
- Mathematics
- Computers and Electronics
Some of my other web sites:

Send mail to Simon Quellen Field via sfield@scitoys.com